This page provides additional information on the methodology and data underpinning the CAST Data Portal. The CAST Data Portal methodology PDF (see below) provides question-wording and response options for the variables used in the CAST Data Portal. These questions were part of a longer questionnaire.
For further details, please contact CAST Deputy Director, Dr Christina Demski (cd2076@bath.ac.uk).
Sampling and sample sizes
Twelve surveys were administered online in four countries (UK, Sweden, China, Brazil) over four years (2020, 2021, 2022, 2023) with adults over 18 years old. The sample was cross-sectional and recruited to be nationally representative (according to gender, age, region and socio-economic status) using quota sampling. Post-stratification weights need to be applied to reach full representativeness. The CAST data portal is, however, based on unweighted data which may result in small deviations from the weighted data. The survey was administered by DJS research.
Question wording and response options
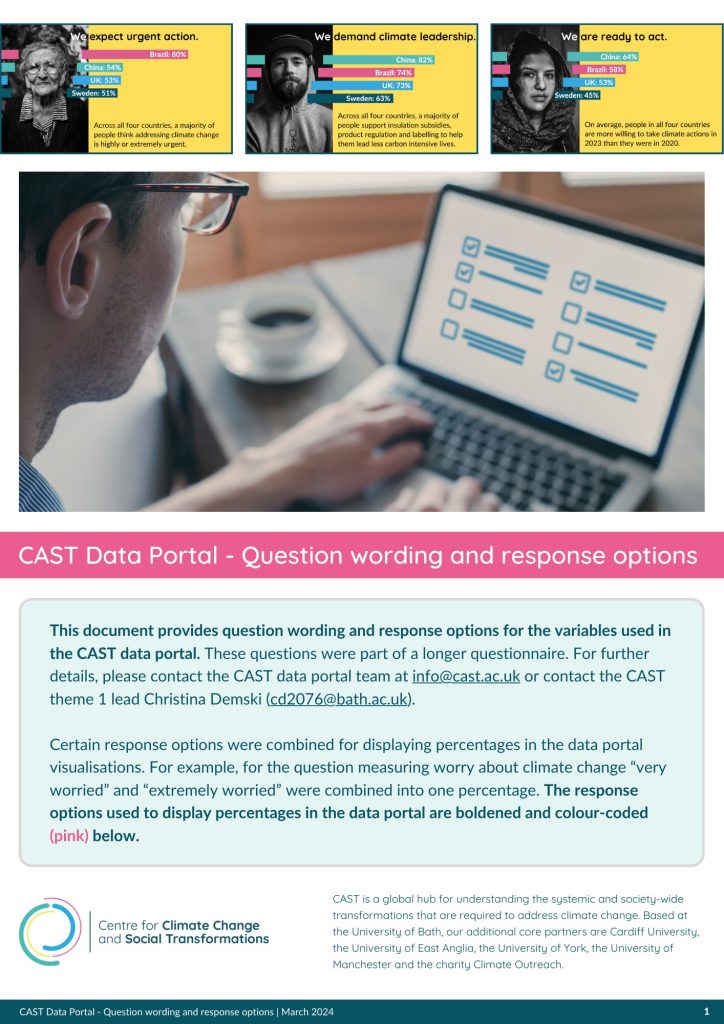
Certain response options were combined for displaying percentages in the data portal visualisations. For example, for the question measuring worry about climate change “very worried” and “extremely worried” were combined into one percentage. The response options used to display percentages in the CAST data portal are boldened and colour-coded (pink) in our CAST Data Portal methodology PDF.
For visualisation purposes, some answer categories were excluded for certain filters or questions (e.g. don’t know). This may lead to slight discrepancies between the dashboard data and results used in accompanying briefings or communications, and figures that may not fully add up to 100%.
We will archive the full dataset in the future for wider use and will update the CAST data portal webpage when this has occurred.
Data accuracy and margins of error
All samples are subject to some degree of sampling error. The margin of error can tell us to what degree our findings may differ from the real-world results, that is how different a stated percentage may be from reality. A smaller margin of error is better as it suggests the survey’s results are more accurate.
At a sample size of 1000, the margin for error for each year and country in the data portal is typically plus or minus three percentage points at the 95% confidence level. This means if we find that 52% of people believe we should reduce meat consumption in our survey, the actual percentage of people in the overall population who believe we should reduce meat consumption is between 49% and 55%, 95 times out of 100 (assuming a margin of error +/-3 percentage point at a confidence level of 95%).
Margins of error are linked to sample size and become smaller if multiple years are combined (larger sample size) or larger if specific subgroups are explored such as across age groups (e.g., smaller sample size). Margins of error also become smaller the higher the response percentage (e.g., if 90% of the sample report being worried about climate change this has a smaller error than if only 55% report being worried). If the sample size drops below 100 respondents, percentages need to be interpreted with caution because the margins of error become too large.
Also note that when comparing percentages (e.g., between age groups or countries), inferential statistics need to be applied to determine if the difference is statistically significant. That is, the difference we observe is reliable and not due to chance alone.
For more information on confidence levels, sample size and response percentages and how they impact the margins of error of a survey/sample, visit the Statistics by Jim website.
Additional biases may occur in the data due to quota sampling used in the surveys (rather than random probability sampling), which means some parts of the population did not have an equal chance to take part in the survey. Nonetheless, the samples were recruited using multiple quality checks to ensure high quality data and target population representativeness.
For further information, contact the CAST team at info@cast.ac.uk.
How to cite the CAST Data Portal:
The CAST Data Portal was led by Deputy Director Dr Christina Demski, Dr Katharine Steentjes and Prof Wouter Poortinga. Please cite this as: Demski, C., Steentjes, K. & Poortinga, W. (2024). CAST Data Portal: Public perceptions of climate change and climate action. The Centre for Climate Change and Social Transformations (CAST). Available at: https://cast.ac.uk/cast-data-portal-public-views-on-climate/
Disclaimer: The CAST Centre provides this data for users of this website to use at their own risks. The data can be used for any legal purpose according to the laws of England and Wales at the discretion of the user. CAST centre is not responsible for any outputs or results produced using the data from this portal, therefore CAST centre is also not liable to the user or to any third party for any kind, form or type of consequential damage or loss caused as a result of the user using data from this website. quential damages that result from the use of, or inability to use, the materials in this site.
Related CAST Briefings and Resources
- (2024) CAST Briefing 26: Public perceptions of climate change and policy action in the UK, China, Sweden and Brazil from 2020 – 2023
- (2024) CAST Survey infographics: Public perceptions of climate change and policy action in the UK, China, Sweden and Brazil
- (2022) CAST Briefing 17: Public worry about climate change and energy security in the cost-of-living crisis
- (2022) CAST Survey infographics: Public perceptions of climate change and policy action in the UK
- (2021) CAST Briefing 10: Public perceptions of climate change and policy action in the UK, China, Sweden and Brazil
- (2021) CAST Survey infographics: Public perceptions of climate change and policy action in the UK, China, Sweden and Brazil
- (2021) CAST Briefing 8: UK Perceptions of climate change and lifestyle changes
- (2021) CAST Survey infographics: UK Public perceptions of climate change and lifestyle changes